Report Generation- Crank out automated reports!

report generation

Two women in an office smiling at a computer screen, one pointing at it while the other sits beside a green bottle on a desk.Report Generation

In market research I would very frequently have to crank out a ton of different versions of reports for a given study.  In the corporate world, like it or not, PowerPoint is still king.  :(   By building a generic template I was able to drastically speed-up my report generation.

Setting up the template takes a little time at first however, in the long run, it will save you an amazing amount of time!

There is a lot more I automated however having a flexible template is always a great place to start!

Close-up of a laptop keyboard and touchpad with a USB drive and Intel and Windows stickers, showing a hardware setup for scripting

Heteroscedasticity & Transformations- Video of “transforming” data

Heteroscedasticity & transformations

Heteroscedasticity & Transformations

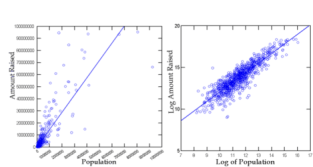
Financial data often has problems with heteroscedasticity also spelled Heteroskedasticity (funnel shaped). Performing transformations is necessary however I often have a hard time explaining what the transformation is actually doing. This video helps show what is happening during a log transformation.

After watching the data literally “transform” it was much easier to grasp exactly what was happening and how it would help.  Just remember you’ll have to transform it back if you wish to interpret the values.  While the below video was created using SYSTAT, I transform data so often I have some killer SPSS macros which transform data effortlessly.

You want your data to be normally distributed around the line which is “homosecasticity“.


If you’re interested in reading more, SAGE has a specific book on Heteroscedasticity & transformations

Psychological affects of the slope- Practical example on my own weight loss

Psychological affects of the slope

I’ve been on a (much needed) diet since mid January.  While my progress is going really well, I was looking at the graph I’d made and was surprised how much my attitude changed when I simply changed the ratio of one axis.  I have been working in stats for ~20 years and I’m well aware of how people purposely try and lie/mislead with graphs so I didn’t think changing the ratio would affect my mood but damn was I wrong!

In the below two graphs they both have the exact same slope & R-square however, the one the left is wider (making it seem like my weight-loss is going slower), than the one on the right.

Which graph would you rather be using to see your progress?   And, yes, I know I truncated the graph at 180.  While weight is a “scale” variable (excuse the pun) I have an ideal weight I’m aiming for.  Besides, nobody wan’ts to see me at 100 lbs.

Psychological affects of the slope

Psychological affects of the slope
This experiment reminded me of Dan Ariely’s books. This one is exceptionally well written and thought provoking.